Streamline Project Management Tasks With Custom Gantt Charts
June 1, 2022
Imagine juggling multiple objects at once. Drop just one, and you ruin the entire performance.
That’s project management in a nutshell.
To ensure nothing gets dropped, use Gantt charts and streamline your project management tasks. Gantt charts give you a high-level view of timelines, dependencies and stakeholders, so it’s not surprising that they are the most desired feature in project management tools, according to a study by Capterra.
Want to build apps with Gantt chart features? Here’s a simple guide to help you get started.
What Is a Gantt Chart?
A Gantt chart is a popular project management tool that illustrates the timeline of a project and its associated tasks.
It was named after Henry Gantt, an American mechanical engineer who used the chart to manage large construction projects in the U.S., including the Hoover Dam on the Nevada-Arizona border. In the early 1900s, he published the first-ever hand-drawn Gantt chart to get a clear overview of their project schedule and easily measure employee productivity levels.
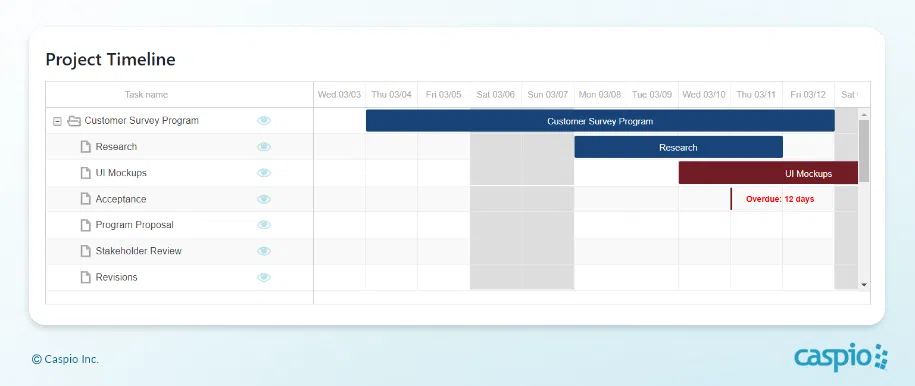
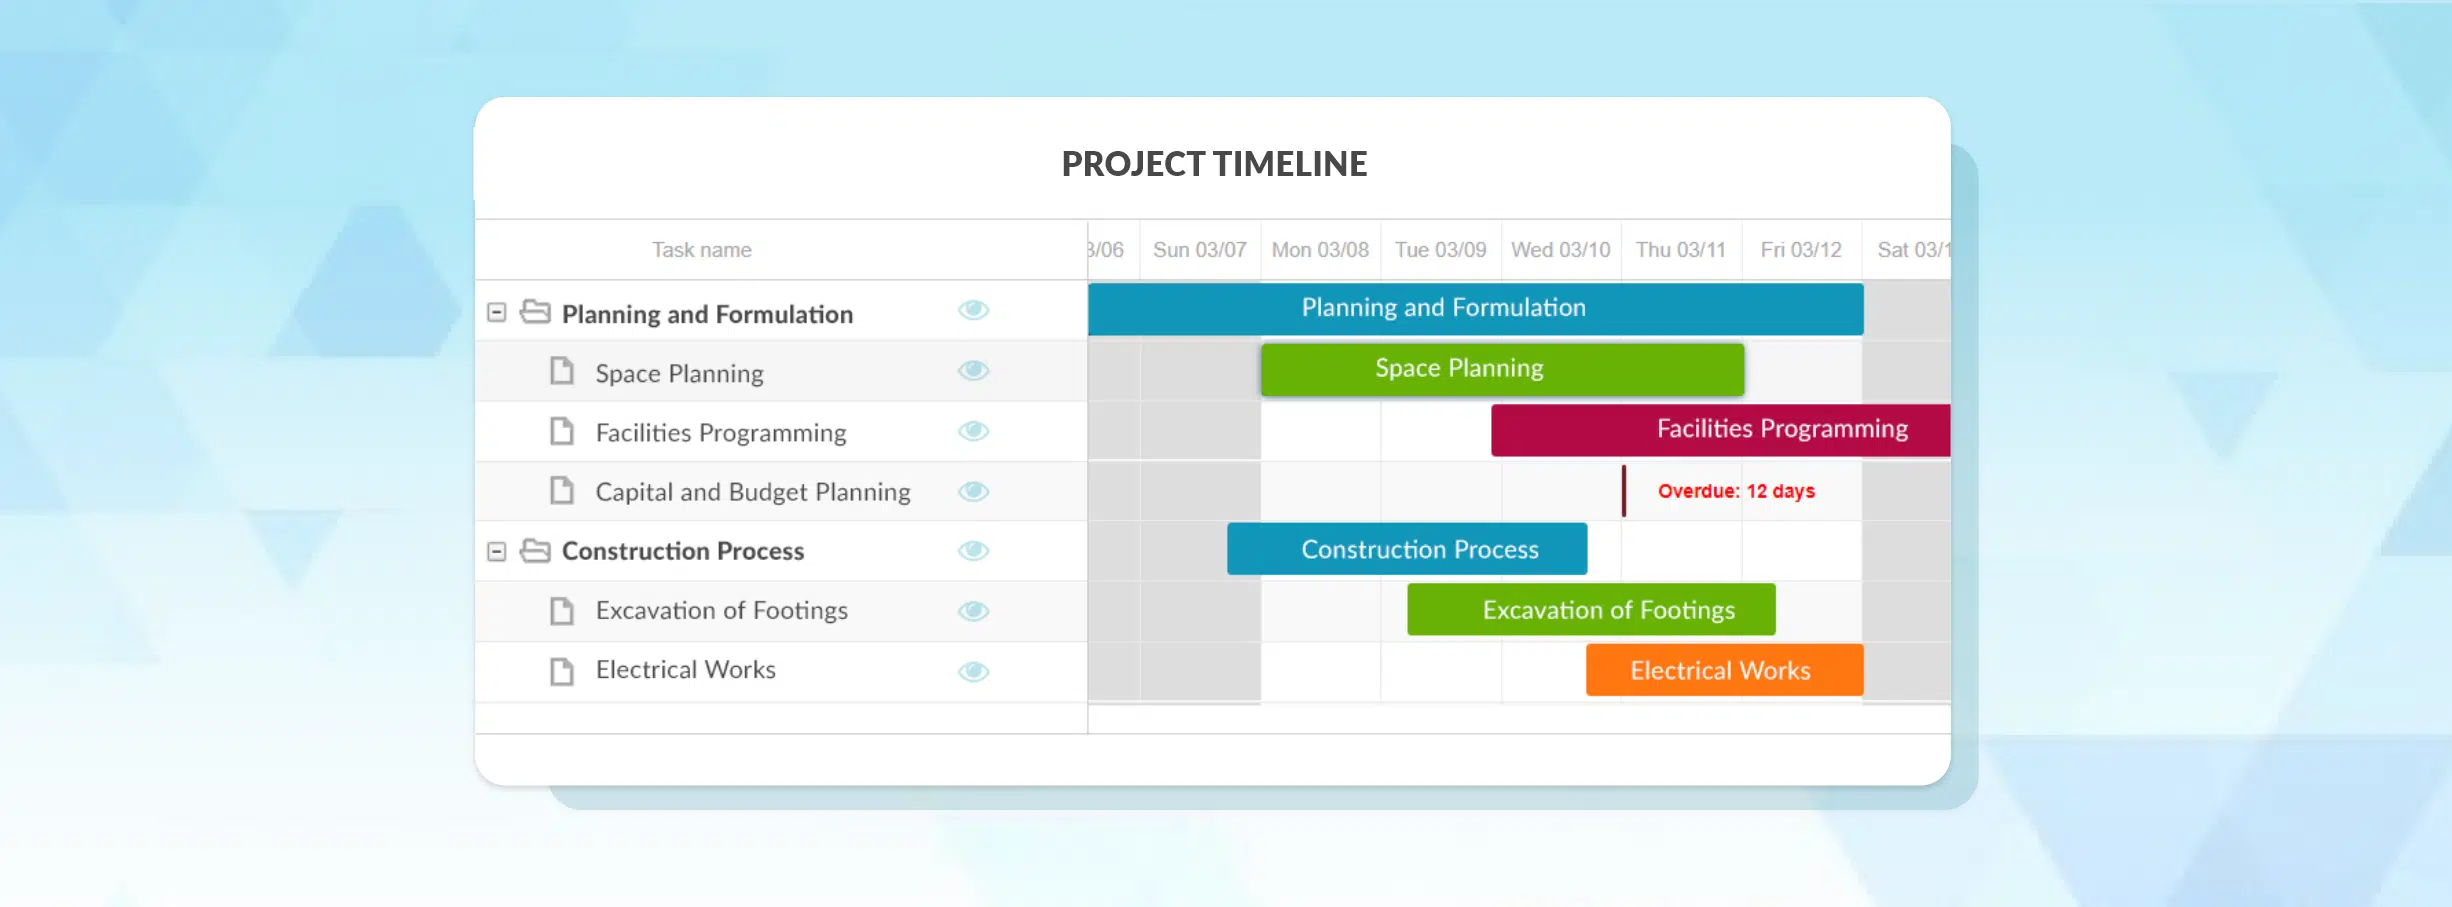
Gantt charts are composed of two main parts: an outline or list of tasks on the left and a timeline with horizontal, colored bars on the right. These visual diagrams typically contain other essential elements, such as:
- Start and end dates of tasks
- Work milestones
- Project/task assignees
- Dependencies between tasks and assignees
When you zoom out of the whole picture, project managers and team members get an overview of pending/ongoing work, project owners and target completion dates. Team members get an at-a-glance insight into their responsibilities and how their work impacts the entire project.
How to Use a Digital Gantt Chart Effectively
Contact us to learn more about implementing Gantt charts in your Caspio apps.
Here’s a simple guide on how to design and use your own digital Gantt chart:
1. Define your project scope
What’s the goal and timeframe? Who needs to be involved? If you have a deadline, write it down. Make your project plan as detailed as possible — it will keep you focused and provide the information you’ll be needing in the succeeding stages.
2. Break it down into tasks
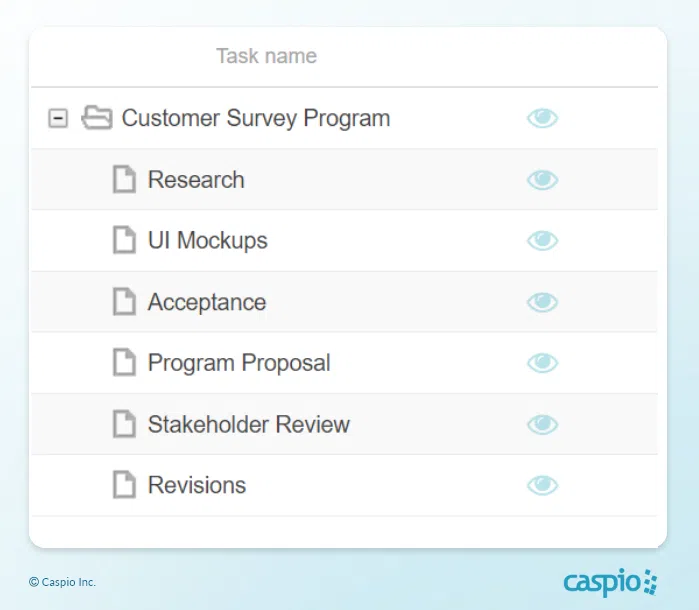
Tasks are the specific activities that go into the project. You’ll need to list and organize them logically to determine your objectives/milestones and eliminate any constraints. It’s also best to combine tasks into groups and timeframes into larger chunks for easy tracking.
3. Use colors to define progress
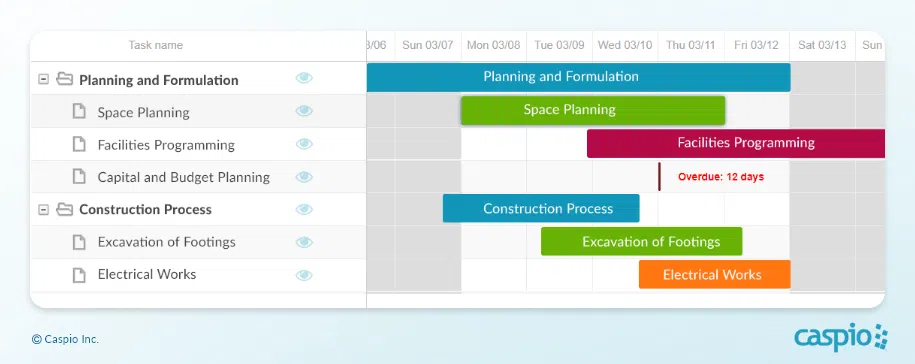
Customizing chart colors helps make progress for each task easily understandable for all users. For example, you can use blue for tasks that are on schedule and red for those that are moving slowly or are overdue.
4. Determine inter-dependent tasks
Dependencies, or the relationships between tasks, create a seamless flow of activities within your project. Setting up dependencies enables you to automatically move all dependent tasks every time you change a specific task. For example, you can’t post an article on social media until it is published on the website. In this case, social media posting is dependent on website publishing, so these two tasks are related.
5. Assign ownership
Every aspect of a project must have an owner. When a person takes responsibility for a task, they’re more likely to ensure that it meets the expected deadline and level of quality. From a project manager’s perspective, you’ll also immediately know who to follow up on if tasks are falling behind. Keep in mind, though, that because Gantt chart structures vary depending on the platform you use, you may need to implement additional customization to display task owners in your chart.
6. Monitor and modify as needed
Be sure to update your Gantt chart to reflect project progress. Review it at least once a week and implement the latest developments. Most digital Gantt charts have real-time capabilities, allowing you to instantly edit tasks or collaborate with other users. An up-to-date Gantt chart helps you stay on track and achieve your goals.
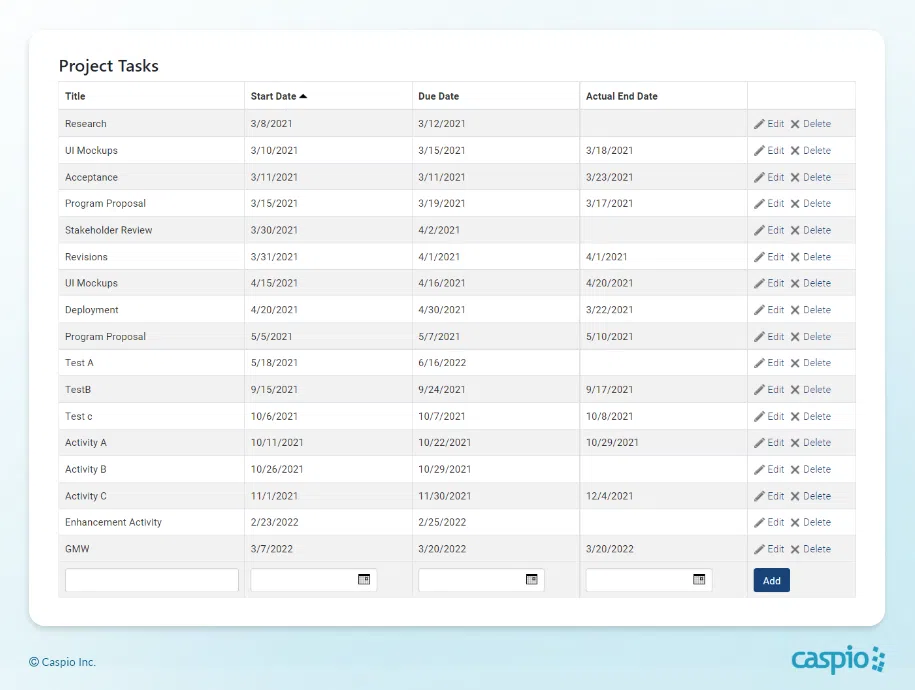
Extend Your Caspio Apps With a Custom Gantt Chart
Gantt charts are highly versatile and can work across a multitude of departments and industries. Here are some ideas on how you can utilize your custom Gantt chart to improve processes:
Project Management
Gantt charts work for various types of project management initiatives. They give you a comprehensive visual as you plan the order of tasks and timelines, set specific schedules and manage multiple resources. Use Gantt charts to track numerous tasks at once, including those that have dependencies. Finally, get the status of each task without checking with team members manually.
Construction Work
Gantt charts are ideal for meeting construction deadlines and ensuring crew members, subcontractors and clients are in the loop throughout the job. Use them to highlight critical tasks and communicate upcoming milestones with your team. Gantt charts are beneficial in reviewing many moving parts during construction and serve as an excellent visual aid when clients ask about schedules and accomplishments.
Manufacturing Control
Ensure proper resource allocation in your manufacturing facility by utilizing Gantt charts as a production reference. Plan the utilization of resources and assign tasks to workers while maintaining accurate time distribution. Adjust to deviations to ensure on-time delivery of goods.
You can even use Gantt charts for auditing your production schedules and processes. For a more precise tracking of schedules, calculate dates automatically using date and time formulas.
Events Planning
Use Gantt charts to break down your event plan into granular details and ensure the event proceeds smoothly from beginning to end. Be sure to group each task accordingly, for example, by planning phase or by vendor. This way, you can keep track of all the small details, especially if there are last-minute changes.
Content Production
Teams that publish a steady flow of content can take advantage of Gantt charts to organize their production timelines and prepare for deadlines. Use it as an editorial calendar where you can see what’s coming up next on the schedule. You can also group tasks by month and topic, and set milestones to track final approvals and publishing dates.
Transform How You Plan and Manage Projects With Caspio
As with Kanban boards, Gantt charts are indispensable tools for organizing tasks and spotting production bottlenecks. They simplify project supervision for managers and facilitate task distribution and execution for team members.
Integrate Gantt charts into your project management applications today.
Caspio’s leading no-code platform combines an integrated cloud database with a visual app builder to help you create fully-featured business applications faster than traditional software development. Caspio also provides professional services to integrate custom Gantt charts into your existing applications.
Want to streamline the way you plan and manage projects?
Contact us today to learn more about adding a Gantt chart to your Caspio-powered web apps.
