Caspio Transparency in Uptime and Performance
June 3, 2013

 Last month, I had the privilege of meeting some of Caspio’s extraordinary customers in the New York and New Jersey area. Aside from seeing all the awesome things they do with Caspio, we wanted to hear first-hand how we can improve our products and services to better meet their specific needs.
One take-away from these meetings is how much we take awareness for granted. Around here we live and breathe Caspio all day, so we forget that others may not be aware of aspects of our service we assume are common knowledge. One such example is the Caspio System Health Report.
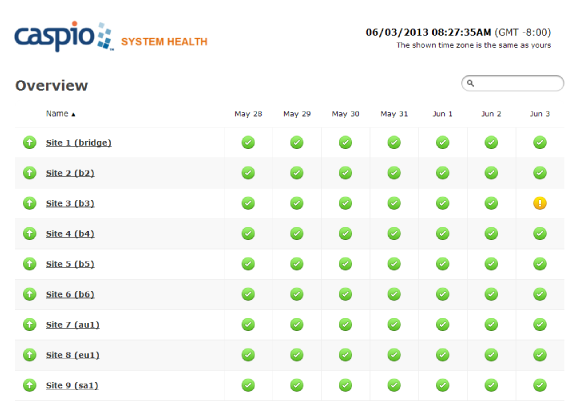
For several years now, we have provided a public website that monitors Caspio’s system performance. At any time, you can visit this website to see real-time and historical data about our uptime and response times by geographic location.
We believe that transparency is integral to the strong relationships we build with our customers. For database platforms, uptime and performance are mission-critical. We measure it relentlessly to stay ahead of industry standards.
It’s worth mentioning a few things about the Caspio System Health Report:
- The content of the website is entirely driven and managed by a third-party service called Pingdom. In fact, we have almost no control over its presentation.
- Your Caspio account is hosted by one of the sites listed on the report and you can tell which site you are on by the URL in any of your deploy codes (see how).
- The monitoring service measures response times by performing a deep search in a DataPage. So the amount of time that is being reported is not for a simple ping, but for a complete download of the search results. While this results in a bigger number, we think it’s a better indicator of Caspio’s service performance.
- The monitoring service performs checks every few minutes from several locations across the globe, and the response times are then averaged from all locations. So if you are a U.S. company on our U.S. data center, your U.S. end users actually experience faster speeds than what’s being reported. Similarly, if you are an Australian customer on our AU data center, keep in mind that the reported response times are skewed by more locations out of U.S. and Europe, so your performance in Australia is actually better. Learn more about our Global Sites for optimal performance.
- Any pre-announced scheduled downtimes will be displayed in gray, while any unscheduled downtimes would be shown in red. If any two monitoring agents cannot reach a particular site or if a response does not come back within the allocated time, the site is declared down until the next time the site is verified and accessed. Any reported downtime is usually less because there is no guarantee that the monitoring agents check back the moment the service is accessible.
- We also pro-actively announce system status alerts on a Twitter feed, accessible via @CaspioStatus or our Support Center. We encourage all of our customers to subscribe to this feed to stay informed about scheduled maintenance and system performance.
We hope you find this service valuable. Please let us know if you have any questions or feedback.


